

 Tweet
Tweet
Which Friday was it they were switching over?


-
Why does the rest of the country get first dibbs on half my income? -
Today is Friday. Perhaps ...
If a man were to know the end of this day's business ere it come.
But it suffices that the day will end, and then the end be known.
And if we meet again, well then we'll smile.
And if not, then this parting was well made.
-- Julius Caesar Act 5, Scene 1Comment
-
Maybe the server is standing by, awaiting it's expected 30% tip."It is an absolute truism that law-abiding, armed citizens pose no threat to other law-abiding citizens."
Ammo, camo and things that go "blammo".
“That rifle on the wall of the labourer's cottage or working class flat is the symbol of democracy. It is our job to see that it stays there.” ― George OrwellComment
-
I'm not a paying customer so I'll enjoy and appreciate whatever service there is.
Connecting with all of you folks is good for my soul.
It would be nice to have the punctuation fixed, though.”A man must judge for himself whether circumstances warrant obedience or resistance to the commands of the civil magistrate; We are all qualified, entitled, and morally obliged to evaluate the conduct of our rulers. ” (John Locke)Comment
-
Agreed. I do check their site and they are the first choice for orders if in stock.
It is weird that you'd only find out about most elsewhere though.Comment
-
I hope that if we get the punctuation fixed,
we don't get a limit of 8000 chars per post.
Which might happen with a software update.
That happened on CGN, and it's annoying -- some of my lists/data, and virtually every news story of merit has to be split over multiple posts.Comment
-
Warning! some sarcasm, facetious and jovial behavior, satire, irony, dry humor, playful banter and more may or may not be involved in my postings. Please read anything I have written as being said in the most joyful and happy voice you can possibly imagine.
Please don't take any of my postings the wrong way and also no disrespect is ever intended.
"The difference between a Socialist and a Communist is that the Socialist doesn't have all the guns yet."
Comment
-
GOC moderator
Dealer/co-founder/co-owner of Tundra Supply Ltd.
www.tundrasupply.ca
June 2013 - The High River Gun Grab - NEVER FORGET !!!!
Feb 26 2014 - Swiss Arms prohibition and ordered confiscation by the RCMP - NEVER FORGET !!!!!
May 1 2020 - Liberal un-democratic mass prohibition order in council. - NEVER FORGET !!!!!
October 21 2022 - Liberals ban all handgun sales and transfers in Canada via order in council - NEVER FORGET !!!Comment
-
Why graphs ?
If one wants to lie, do it in a sentence. It's virtually impossible for a human being making an argument to choose anything but biased cherry picked data points in a sentence.
If one wants to see the truth, show it in a multi-year graph.
If one wants to be honest, don't cherry pick the year end points for the graph, but rather round them to either "all the data that's available for every year" or "multiples of 5 years or 10 years before today". (Statcan frequently shows 10 years ago, but not the years in-between, that's semi-honest -- unless they delete 10 year trends when they don't like the tale)
Parliament doesn't allow images -- forcing them to give data in sentences, forcing them to lie.
Liberals take that lying to another level, by literally ignoring facts.
Langmann was once in committee, and showed a multi-year graph. Liberals were red-in-the-face furious.
PolySeSouvient presentations and letters and PDFs and news articles are virtually always sentences.Comment
-
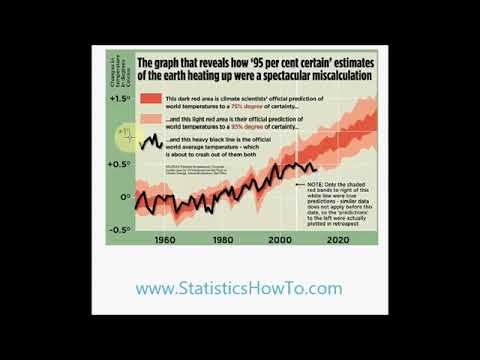
Misleading Graphs: Real Life Examples
Misleading Graphs in Real Life: Overview
Misleading graphs are sometimes deliberately misleading and sometimes it?s just a case of people not understanding the data behind the graph they create. The ?classic? types of misleading graphs include cases where:
The Vertical scale is too big or too small, or skips numbers, or doesn?t start at zero.
The graph isn?t labeled properly.
Data is left out.
But some real life misleading graphs go above and beyond the classic types. Some are intended to mislead, others are intended to shock.
And in some cases, well-meaning individuals just got it all plain wrong. These are some of my favorite recent-history misleading graphs from real life.
In statistics, a misleading graph, also known as a distorted graph, is a graph that misrepresents data, constituting a misuse of statistics and with the result that an incorrect conclusion may be derived from it.
Graphs may be misleading by being excessively complex or poorly constructed. Even when constructed to display the characteristics of their data accurately, graphs can be subject to different interpretations, or unintended kinds of data can seemingly and ultimately erroneously be derived.
Misleading graphs may be created intentionally to hinder the proper interpretation of data or accidentally due to unfamiliarity with graphing software, misinterpretation of data, or because data cannot be accurately conveyed. Misleading graphs are often used in false advertising. One of the first authors to write about misleading graphs was Darrell Huff, publisher of the 1954 book How to Lie with Statistics.
Data journalist John Burn-Murdoch has suggested that people are more likely to express scepticism towards data communicated within written text than data of similar quality presented as a graphic, arguing that this is partly the result of the teaching of critical thinking focusing on engaging with written works rather than diagrams, resulting in visual literacy being neglected. He has also highlighted the concentration of data scientists in employment by technology companies, which he believes can result in the hampering of the evaluation of their visualisations due to the proprietary and closed nature of much of the data they work with.Warning! some sarcasm, facetious and jovial behavior, satire, irony, dry humor, playful banter and more may or may not be involved in my postings. Please read anything I have written as being said in the most joyful and happy voice you can possibly imagine.
Please don't take any of my postings the wrong way and also no disrespect is ever intended.
"The difference between a Socialist and a Communist is that the Socialist doesn't have all the guns yet."
Comment
-
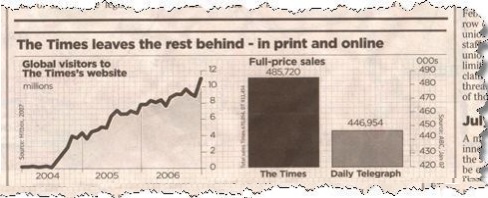
There must be better examples of misleading charts.
A lot of those are two data point charts -- which may as well be sentences. Choosing a small axis range is a good thing to show fine clarity, but the way it was used just to have a graphic was poor.
Her comment about using two y axis is daft. Using two y axis is the correct and only way to present that data, and it's used every day and does very well when trying to corelate two pieces of data which the graph she's complaining about.
-- Source: distinct <span class="username"> within https://www.gunownersofcanada.ca/sho...ed-punctuationComment
-
[not worth watching]
How to spot a misleading graph - Lea Gaslowitz
2017, 4 minutes
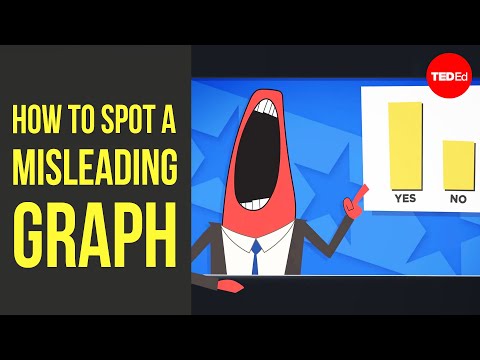
Here they've manipulated the X-axis to change the slope of the line, combined with cherry picking a few points instead of all available data.
(and of course, it's relevant that the chart starts in 2008 (Dec 2007 is 2008), given the 2008 financial crisis. It may be that 2000-2007 data, had it been included, might show a restoration to normal values particularly if adjusted per capita/population, rather than the panic the first graph inspires)Comment
-
Impressive. Every word in that sentence was wrong.
-- Luke Skywalker, Star Wars: Episode VIII - The Last Jedi (2017)
Every word of what you just said... was wrong.
-- Luke Skywalker, Star Wars: Episode VIII - The Last Jedi (2017)
- Obviously I'm neither happy nor elated about it. Otherwise I wouldn't have made post #53.

- My ridiculous post count is mostly due to
- overzealous participation in the laugh thread
- a pet peeve of not being able to like a post because there are two memes in one post, one of which is uproariously funny and the other of which is disgustingly offensive -- thus I put one image per post unless it takes multiple images to make one point
- When I have to post more than 3 graphs/images in one post, I host them on my website. e.g. https://www.gunownersofcanada.ca/sho...5-s-Collection has 55.
I also host on my website when GoC's attachment feature (which I otherwise currently really appreciate despite its flakiness) converts it to a jpg of insufficient resolution for it to be readable, and I care about its readability.
Comment
- Obviously I'm neither happy nor elated about it. Otherwise I wouldn't have made post #53.


Comment